How to Compare Two Pools' Shares of the Network
Pool share is the only comparison metric that is directly verifiable and directly relevant: a 2% pool should find about 2.88 blocks a day, a 0.5% pool about 0.72. Everything else on a pool's homepage is either a fee schedule or a dashboard view of the same number. Compare share first, then fees, then cadence.

Key takeaways
- The network mines 144 blocks a day; multiply any pool's share by 144 to get the blocks it should find daily, which makes share claims testable against a block list.
- A 1% pool finds a block roughly every 16.7 hours on average, while a 0.5% pool averages a 33.3-hour gap — same expected income per unit of hashrate, different timing risk.
- At 2 PH/s (about 0.2% of the network), 30 days of mining yields roughly 0.0269 BTC gross, near $2,279.71 at a BTC/USD of 84,692, before any listed fee.
- Joining a pool is free; the cost appears as a listed percentage applied to specific payout components, so compare what each percentage touches rather than the headline figure.
The short answer
Divide the pool's published hashrate by the network's, and you have its share. On 21 September 2026 the network ran at about 1,003 EH/s, so a pool sitting at 20.06 EH/s holds a 2% share. That number predicts two things you can measure from outside the pool: how many blocks it should find each day, and how long the gaps between them should be.
Run the same arithmetic before you compare fee schedules, because share determines the income pattern a fee is applied to. Two pools listing identical percentages can behave very differently if one finds 60 blocks a month and the other finds 900, and the reason is almost always share, not marketing.
How the mechanism works
Bitcoin's 3.125 BTC subsidy is paid to whoever finds each block, and the network finds 144 of them a day. A pool with 2% of network hashrate therefore expects 2.88 blocks and 9 BTC of subsidy per day across its miners, while a 0.5% pool expects 0.72 blocks and 2.25 BTC. Those figures are the pool's gross intake; the fee applies to how that intake is redistributed, not to whether it arrives.
| Pool share of network | Equivalent hashrate | Blocks expected per day | Average gap between blocks | Block subsidy collected per day |
|---|---|---|---|---|
| 0.5% | 5.02 EH/s | 0.72 | 33.3 hours | 2.25 BTC |
| 1% | 10.03 EH/s | 1.44 | 16.7 hours | 4.50 BTC |
| 2% | 20.06 EH/s | 2.88 | 8.3 hours | 9.00 BTC |
| 5% | 50.15 EH/s | 7.20 | 3.3 hours | 22.50 BTC |
| 10% | 100.31 EH/s | 14.40 | 1.7 hours | 45.00 BTC |
The mechanism underneath is share accounting. Your machine submits shares against an easier target than the network's; the pool counts them and, when it does find a block, converts them into payouts. Under PPS+ the block-reward part is settled per share with a listed 4% fee, and the transaction-fee part is distributed with PPLNS logic at a listed 2% fee; under PPLNS both parts are combined and distributed with a listed 2% fee after the block reaches six confirmations, using each miner's share of pool hashrate across the last five difficulty rounds.[1]
That means a smaller pool does not pay less per terahash on average under PPLNS or under PPS+. It pays less evenly. The 2026 picture matters here: with difficulty at 132.76 T and the next adjustment estimated at 2.12% lower, pools that publish their hashrate and block history make this arithmetic checkable rather than a matter of trust.
Where miners get it wrong
Confusing pool share with your share. Your income depends on your terahashes divided by the network, not by the pool. A 2 PH/s rig earns the same expected BTC in a large pool and a small one; what changes is the size of your slice of a smaller, lumpier cake.
Reading a headline fee as a total haircut. A PPS+ schedule is not a flat charge on everything you earn, because the 4% and the 2% apply to different components of a payout. The published breakdown exists to keep that distinction visible, and a pool that will not separate the components is telling you something about its reporting.
Ignoring latency and node coverage. Shares submitted late are stale, and stale shares earn nothing. A pool with nodes near your machines throws away less of your work than a distant one, which is a real cost that never appears in a fee table.
Optimising share while ignoring uptime. A 10 PH/s farm loses about $15.83 of expected income for every hour it is down at current difficulty. Over a month, a handful of these events costs several times more than any plausible difference between two fee schedules.
What a worked comparison looks like
Suppose you run 2 PH/s, which is 0.2% of the network. In a 2% pool you are 10% of the pool's hashrate; in a 0.5% pool you are 40% of it. Expected output is identical — about 0.000897 BTC a day, or $75.99 — and 30 days produces roughly 0.0269 BTC gross, about $2,279.71, or $2,188.52 after the listed 4% fee on the block-reward component.
The difference appears in the distribution. The 2% pool expects 2.88 blocks a day, so over 30 days roughly 86 blocks arrive and your PPLNS slice is recalculated constantly. The 0.5% pool expects about 21.6 blocks in the same window, which means the income curve has a few long flat stretches. Neither pool is choosing to pay you less; they are exposing you to different amounts of timing risk. A small pool also lets you watch how close its realised block count tracks the 144-blocks-per-day arithmetic, which is exactly what a mining statistics page is for.
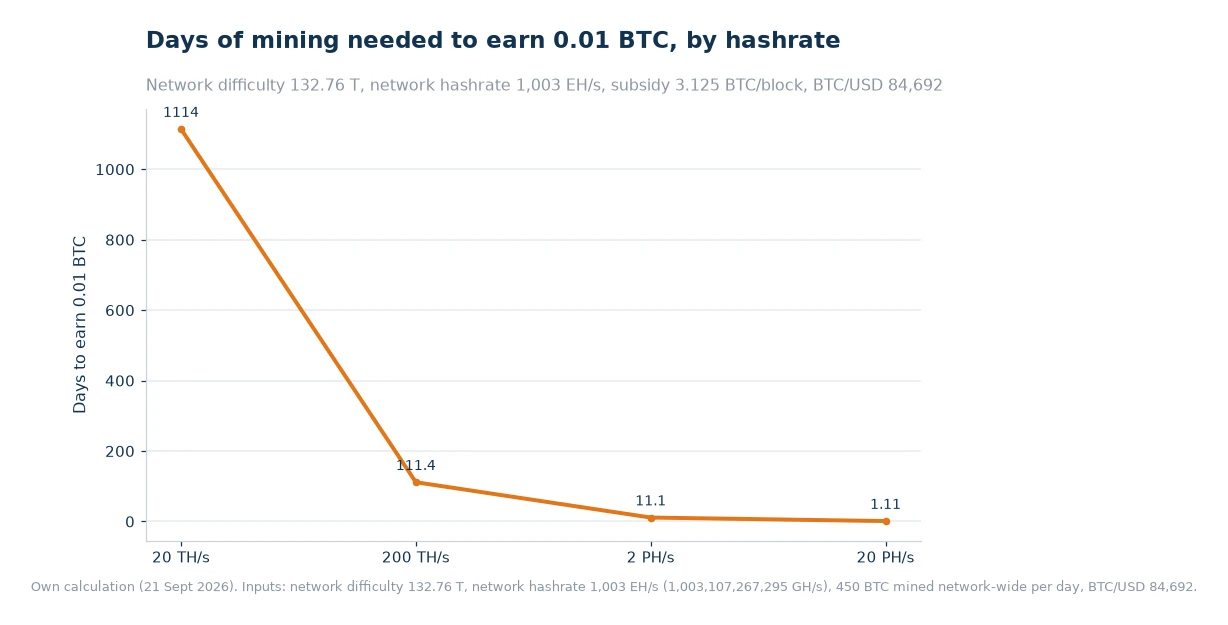
For scale on the same chart: 20 TH/s needs about 1,114 days to produce 0.01 BTC, 200 TH/s needs 111 days, 2 PH/s needs 11.1 days and 20 PH/s about 1.1 days. Anyone comparing pools while running 20 TH/s is optimising a figure worth about $0.76 a day gross, which is worth knowing before spending a weekend on the decision. Machines in that bracket are better judged with a miner profitability ranking against their electricity cost.
What actually deserves attention in a comparison is the quality of the reported share figure. A pool that publishes pool hashrate, network hashrate, difficulty and miner count every few minutes is showing you the inputs to its own payout math. That is what the ViaBTC BTC Mining Pool state view does, and it is the first tab worth opening in any pool evaluation.
A checklist you can run today
- Verify share, don't read it. Take the pool's published hashrate, divide by the network total, and compare the result with the block count you can see in the last seven days.
- Write down both fee components. Note what the PPS-side percentage applies to, what the PPLNS-side percentage applies to, and whether the two are blended in any reporting you rely on.
- Check settlement and confirmation rules. Hourly settlement at current difficulty versus distribution after six confirmations changes your working capital needs more than a fraction of a percent of fee.
- Measure your own latency and stale-share rate. If reject rates are above a fraction of a percent, the node you connect to is the problem.
- Test the multi-coin story. Merged mining lets one machine secure a parent chain and an auxiliary chain at the same time, and a pool covering BTC, BCH, LTC/DOGE, KAS and other chains lets you switch targets without moving hardware — useful when one coin's difficulty gets crowded.
- Confirm where payouts land. Zero-fee mining payouts into an account you already use removes transfer steps that quietly erode small balances.
Frequently asked questions
Can I mine more than one coin at the same time?
Yes. Merged mining lets a machine secure a parent chain and an auxiliary chain together, and multi-coin pools support switching between chains without moving hardware.
Do mining pools cost anything to join?
Joining is free; the pool earns from its fee on settled payouts, which appears as a percentage of the block-reward and transaction-fee components.
Is a bigger pool always better for a small miner?
Bigger means steadier, not richer. Expected income per terahash is set by network share; a larger pool narrows the timing variance of PPLNS payouts and usually shortens the wait between blocks credited to it.
Why do two pools with the same listed fee pay different amounts?
Because the percentage may apply to different components, because stale-share rates differ with node distance, and because uptime and orphan handling differ. Compare realised income per terahash per day over a full adjustment period, not a single day.
Compare like for like, then stop
Pick the share figure, verify it against a block list, then read the fee schedule line by line. If two pools survive that, choose on latency, payout cadence and where the coins land — those are the items your monthly statement actually reflects. Recheck the comparison after each difficulty adjustment, when realised income per terahash shifts for every pool at once.
Data and sources: ViaBTC fee schedule and component breakdown[1], ViaBTC pool statistics[2] and miner profitability ranking[3]. Network hashrate (1,003 EH/s), difficulty (132.76 T), the 144 blocks mined per day at 3.125 BTC each and the BTC/USD price of 84,692 come from public chain data and market feeds read on 21 September 2026; block counts, gaps, share conversions and 30-day income figures are our own calculation from those inputs. Values change with difficulty and price; nothing here is a projection of returns.